The law of diminishing returns is such that you sometimes spend an increasing amount of effort for a small incremental gain. Its obverse, that sometimes the first step on the road to awesomeness has a huge effect, can also be true. This post is about how fifteen minutes will save you $1k or more. (Not on car insurance.)
I have been a long-time customer and fan of RescueTime, but rarely have I blogged about it. (This is a totally unsolicited, non-paid post, but you will forgive me for sprinkling in an affiliate link or two, considering the time and effort it took to write this). If you are not familiar with RescueTime, essentially what it does is spies on your computer use, just like Big Brother, and builds epic charts. By magic, it knows that XCode and FogBugz are “Software Development” and are “Very Productive (+2)”, and its automatic categorization requires tweaking only very rarely. I can see individually how my time is distributed between various software development projects (it knows when I’m using XCode on Project A vs Project B) and I get pretty graphs for that. And then there are other features like temporarily blocking distracting sites and getting alerts when you are wasting too much time. It’s not as evil as it sounds, and at any rate read their privacy policy and see if it’s something you can live with.
Anyway, they bill this thing as saving “3 hours and 54 minutes worth of productive time per week per person.” But people like you and me know that words like “average” are worse than useless. Do you believe in statistics and math, in p-values and hypothesis testing? Do you want an article that at least pretends to be statistically rigorous in its conclusions? You’ve come to the right place. Read on, friend, for the stunning conclusion. A jaw drop in fifteen minutes or your money back.
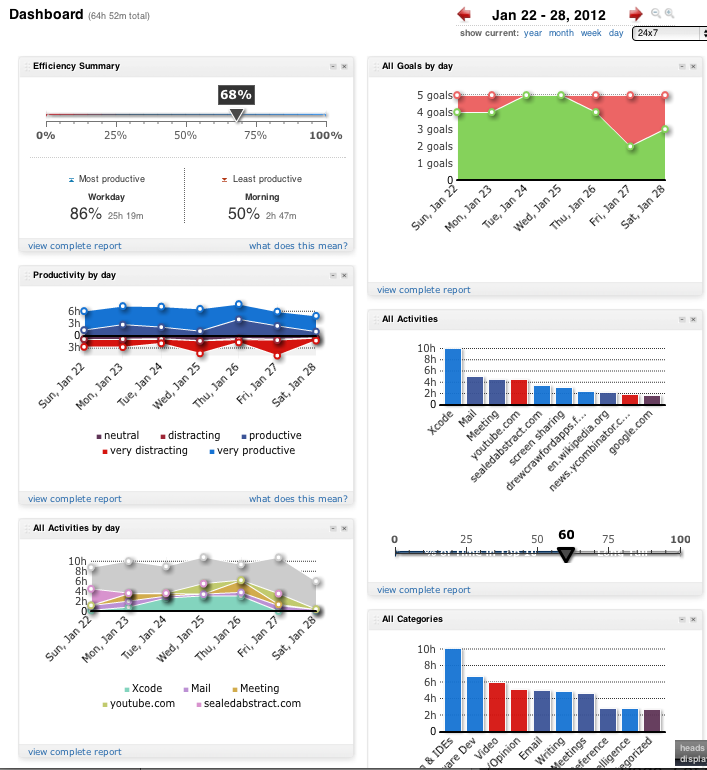
The trouble with RescueTime is that it’s a lot less of a solution as it is a toolbox you can use to build a solution. For example, here is a screenshot of my Dashboard:
What the… Yeah, that’s cool, but there’s just a lot of stuff on this page to take in. (And this is a very small subset of all the crazy things you can do with RescueTime). Tracking your time becomes on the order of a nuclear test launch. For a long time what I would do is log in once in awhile, click around for a bit, say “Yeah… that’s a lot of charts…” and log back out.
The first clue came in December when I got a notification that my subscription was going to expire, and I couldn’t remember actually having logged in, in like, six months. I have this fantastic intelligence tool, but I don’t actually use it, or even have it in any way configured to be remotely usable. That was a light bulb moment for me. This is good enough to pay for, but not good enough to use? Something is wrong here.
I thought about this at some length and decided I just needed to man up and use it in a more disciplined way. What I ended up doing is writing down just a couple of statements. Things like:
- I should be “in the zone” doing something productive more than four hours a day.
- I should be actually writing software (a subset of “in the zone”) for more than three hours a day. Important to emphasize here that a lot of my work lately has been on the sales, client management, project management end, so this is a goal I have to fight for.
- I shouldn’t be reading too much Reddit, RSS, or HN during the workday.
Basic “I know this is a problem” statements, ones which I have always known in the back of my mind were issues with my time allocation. Then I just created a Rescuetime Goal for each of these:
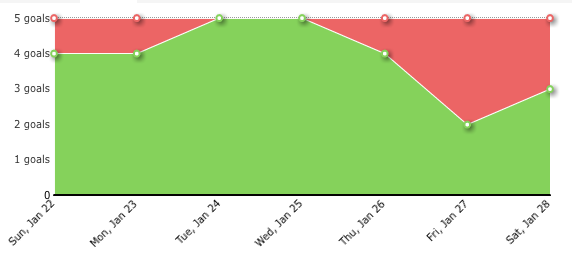
Then, rather than the clutter of the 50 bajillion Dashboard charts, I started focusing on just one:
This chart tells me how I’m doing on my goals relative to the days before and after. It’s just enough information to digest in 30 seconds.
The Important Part
And this is the key to the entire blog post: As a new year’s resolution, I promised myself that for 30 days, come hell or high water, that I would log in and stare at this one chart for 30 seconds.
The problem with “resolutions” is that people drastically over-estimate their own willpower, break them, and then give up. The key to this whole exercise was deciding to do something so absurdly simple that there was no excuse not to do it. Note that I am not making any kind of pact to actually behave any differently–I’m not promising to write more software or read Reddit less. I’m not even saying to myself that I should be doing those things in theory, that they are even good–not even making a pact to feel really bad about it if I don’t meet my goals. All I’m doing is promising to look at a chart. For 30 seconds. On my busiest day, when I have a gun to my head and don’t even have time to eat, I can spare 30 seconds to look at a chart. There is literally the minimum possible effort for self improvement, the quantum orbit level of productivity.
And at the end of 30 days I would crunch the numbers, compare to previous months, and if it didn’t produce something useful I would quit. So long, RescueTime, glad some people like you, but I’m not going to pay for a tool I never use.
By the numbers
So how did this little experiment work out? Did it make any difference?
Before I go any further I have to concede to the statistics nerd that I am about to do a very important cheat: what you really should do, when you try to determine if performing some action has any effect, is do randomized trials. It is possible, for example, that there is some external factor that makes January simply a better month than November that has nothing to do with my use of RescueTime. (I don’t believe this is the case, simply because in our line of work we swap between different kinds of projects depending on the market, but the total volume of work we do remains constant. You may or may not believe this.) You can control for confounding factors by randomly deciding whether or not to look at the chart each day, rather than having one month of Algorithm A and another month of Algorithm B. The problem with doing a truly randomized trial in this situation is that the effect of looking at the chart is cognitive–it affects you not just for the 30 seconds you are looking at it, but the anticipation that you will look at it affects how you behave in prior days, and looking at the chart itself has a cognitive effect that lasts several days. So I believe on this basis that a fair randomized trial may not be possible, although I acknowledge that there may be room for improvement in my method.
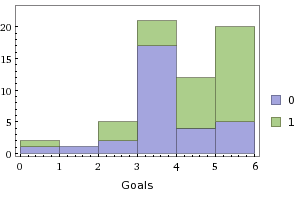
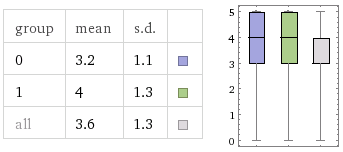
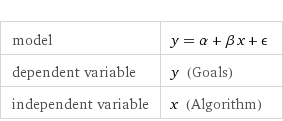
With that out of the way, here are the numbers. Algorithm 0 is the “don’t look at the chart” algorithm, Algorithm 1 is the “look at the chart” algorithm.
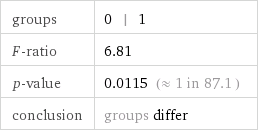
Just in case you are not a statistics nerd, Wolfram Alpha sums it up nicely:
In other words, we can be statistically confident that looking at the chart causes me to meet more goals. How many more? The clue is in the value for “Beta” depicted in the table above–A net gain of .7989 +/- .3062 additional goals, with statistical confidence of 95%.
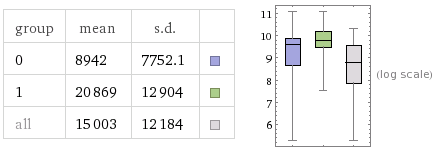
But what does a gain of .7989 goals mean exactly? It’s a good thing, certainly, but it’s somewhat arbitrarily good. Instead, let’s do an analysis of my “Very Productive Time” for Algorithm 0 vs 1:
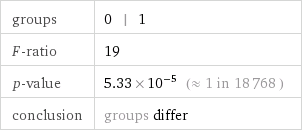
Once again, Wolfram Alpha sums it up nicely for the statistically-challenged:
So how much better, quantitatively, is looking at the chart than not? Again, we turn to the Beta term, where we discover that our 30 seconds of looking at the chart have saved us about 11,927 seconds per day +/- 2737 seconds, with 99% confidence.
That’s not RescueTime’s claim of “3 hours and 54 minutes a week”! It’s in fact 3 hours and 18 minutes a day. Read that sentence again. I’ve held off publishing this result, because I was certain it was too absurd to be right. It’s right. I checked.
Assuming that your job as a computer programmer pays you the patently absurd wage of $10/hour, spending 30 seconds looking at this chart will save you $33 per day, or almost $1k per month. Staring at this chart is only 15 minutes of work a month. If looking at the chart had a billable rate, it would be $4,000 an hour. Now multiply that by whatever multiple of $10/hour you’re actually worth. This is the most absurd time/value tradeoff I’ve ever seen.
You can do similarly fun ROI gymnastics with paying off the investment of buying RescueTime. Suppose you’re on yearly billing at $6/month. At our absurd $10/hour wage, with a savings of $33/day, with a usage time of 30 seconds, you pay back RescueTime each month in the first 5.5 seconds you use it each month. That’s crazy talk.
Some subjective analysis
So hopefully now you believe that it works, but why does it work?
The simple explanation is that I like optimizing for scoring functions, and the chart is a scoring function. I go through the day feeling that I have to “achieve” 3 hours of coding a day now. The danger of this might be that you might feel it is okay to stop at three hours, but at least for me the friction is all in the starting and none in the stopping. If I get on a roll I can code for 8 hours in one sitting, but it’s the first ten minutes that are the hardest.
The danger, of course, is that the scoring function can be gamed. I’ve blogged about this before:
The only bad thing about RescueTime is that it’s taught me to play the game–now I watch a lot of videos on my iPad instead of my Mac because they aren’t tracked.
Like the manager who optimizes for the number of checkins, there is definitely an element of gaming the system here–doing more things on my iPad where they won’t affect my scores. However, when I wrote that sentence I think I failed to really understand the power of context. Having a video on an iPad that I have to get out of my chair to and get out of a bag and open a little velcro fastener is a lot less dangerous than having it on my Mac where I’m trying to do work. So even though I think I’m gaming the system by doing all this “untracked” stuff–it’s really the system that’s gaming me. Paul Graham wrote in how to lose time and money:
The most dangerous way to lose time is not to spend it having fun, but to spend it doing fake work. When you spend time having fun, you know you’re being self-indulgent. Alarms start to go off fairly quickly. If I woke up one morning and sat down on the sofa and watched TV all day, I’d feel like something was terribly wrong. Just thinking about it makes me wince. I’d start to feel uncomfortable after sitting on a sofa watching TV for 2 hours, let alone a whole day.
And yet I’ve definitely had days when I might as well have sat in front of a TV all day—days at the end of which, if I asked myself what I got done that day, the answer would have been: basically, nothing. I feel bad after these days too, but nothing like as bad as I’d feel if I spent the whole day on the sofa watching TV. If I spent a whole day watching TV I’d feel like I was descending into perdition. But the same alarms don’t go off on the days when I get nothing done, because I’m doing stuff that seems, superficially, like real work. Dealing with email, for example. You do it sitting at a desk. It’s not fun. So it must be work.
When I’m doing something distracting on an iPad, mental alarms go off. I know that I am doing something unproductive, and it feels like it. I know that I am gaming the system, and I feel bad about it. I might experience the same mental alarm level from three hours of distracting time on my Mac that I do in 30 minutes on my iPad. So while I might think that I am trading 30 minutes on this device for 30 minutes on that device–the reality is quite different.
Effectively what RescueTime does for me is it solves the “things that feel like work but aren’t” problem. Time spent reading documentation, in IDEs, and on StackOverflow == real work. E-mail, meetings, probably real work. That Reddit debate though, fake work. Opening 25 tabs on Wikipedia, fake work. The mental alarm doesn’t go off for those by default, but with RescueTime looking over my shoulder, it does.
The other reason that I believe the “game the system” theory is overstated is because the effects I’ve measured in my experiment are a lot more far-reaching than the specific goals I optimizing for. The massive uptick in Very Productive Time was not something I was deliberately trying to optimize for, or was even thinking about during the experiment; it’s a second-order effect. If there was a strong gaming effect in play you would expect some other metric to get worse to compensate for the improvement in the particular metric I was gaming. But what you actually see is a very strong improvement all across the board. So while I acknowledge there is a gaming effect here, I believe it is small relative to the overall impact.
Look at the freaking chart
I promise I’m not a shill. I don’t push products on this blog, like, ever. Mostly I complain about them. This is my actual data and nobody at RescueTime knows that I have done this. Now go out and build the freaking chart and stare at it for 30 seconds a day. And if my post motivated you to do this, use my affiliate link. Shameless plug.
Want me to build your app / consult for your company / speak at your event? Good news! I'm an iOS developer for hire.
Like this post? Contribute to the coffee fund so I can write more like it.
Comments
Comments are closed.







 Tags
Tags 
Interesting. I keep meaning to try rescuetime, but haven’t got around to it. I think I might be scared what it is going to tell me!
So much for your post “Why I stopped reading HN” back in September. I think I may have the same problem with wasting time, and may give that RescueTime link a try
sealedabstract.com/rants/why-i-stopped-reading-hn